Meshing and Simulation of reversed Y-pipe structures
Y-pipe structures are widely used in many manufacturing and research areas for mixing different reactants solutions. The flow behaviors inside a Y pipe are worth studying to improve the mixing efficiency and control the flow properties. In this study, two different configurations of Y pipes are investigated. This structure is used for biomaterial production. Each pipe has varying cross-sections with restrictions and enlargements, which require very subtle handling of the near-wall regions to obtain high-quality mesh. The mixing chamber in the middle needs a particularly careful setup.
Pointwise is used for the mesh generation in the two Y pipes. The T-Rex function of Pointwise for both 2D and 3D cells is implemented in this case to achieve a smooth transition of cells from the wall to the inner part. T-Rex allows us to grow layers of rectangular cells given the first cell thickness and a growth factor, and the inflation is stopped once a smooth dimensional transition with the rest of the surface mesh is achieved.
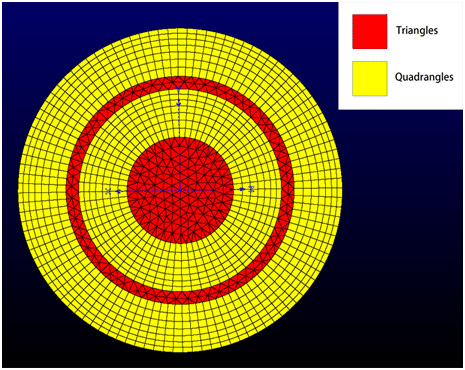
Figure 1 – 2D cells on the inlet surface of Y-pipe 1
For the two inlets and the outlet surfaces, the 2D T-Rex method is used in these domains. For the 2 inlets, quadrangle cells are grown from two boundaries, as shown in the yellow part in Figure 1. The first layer is from the outer wall of the inlet. The inlet pipe has a narrowed cross-section afterward, which means the diameter of the pipe becomes smaller. Thus, there is a second layer of quadrangle cells growing from an inner surface, which is aligned with the narrowed cross-section. Hence, the extrusion of the surface mesh can directly represent the 3D structure of inlet pipes.
From the 2D inlet and outlet surfaces, the 3D cells are generated by extruding the surface, leading to the hexahedral cells (blue) near the walls and isotropic prisms cells in the middle(green). The hexahedral cells come from extruded quadrangles and prisms come from extruded triangles.
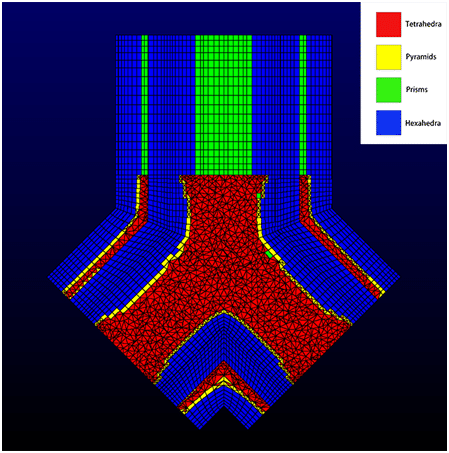
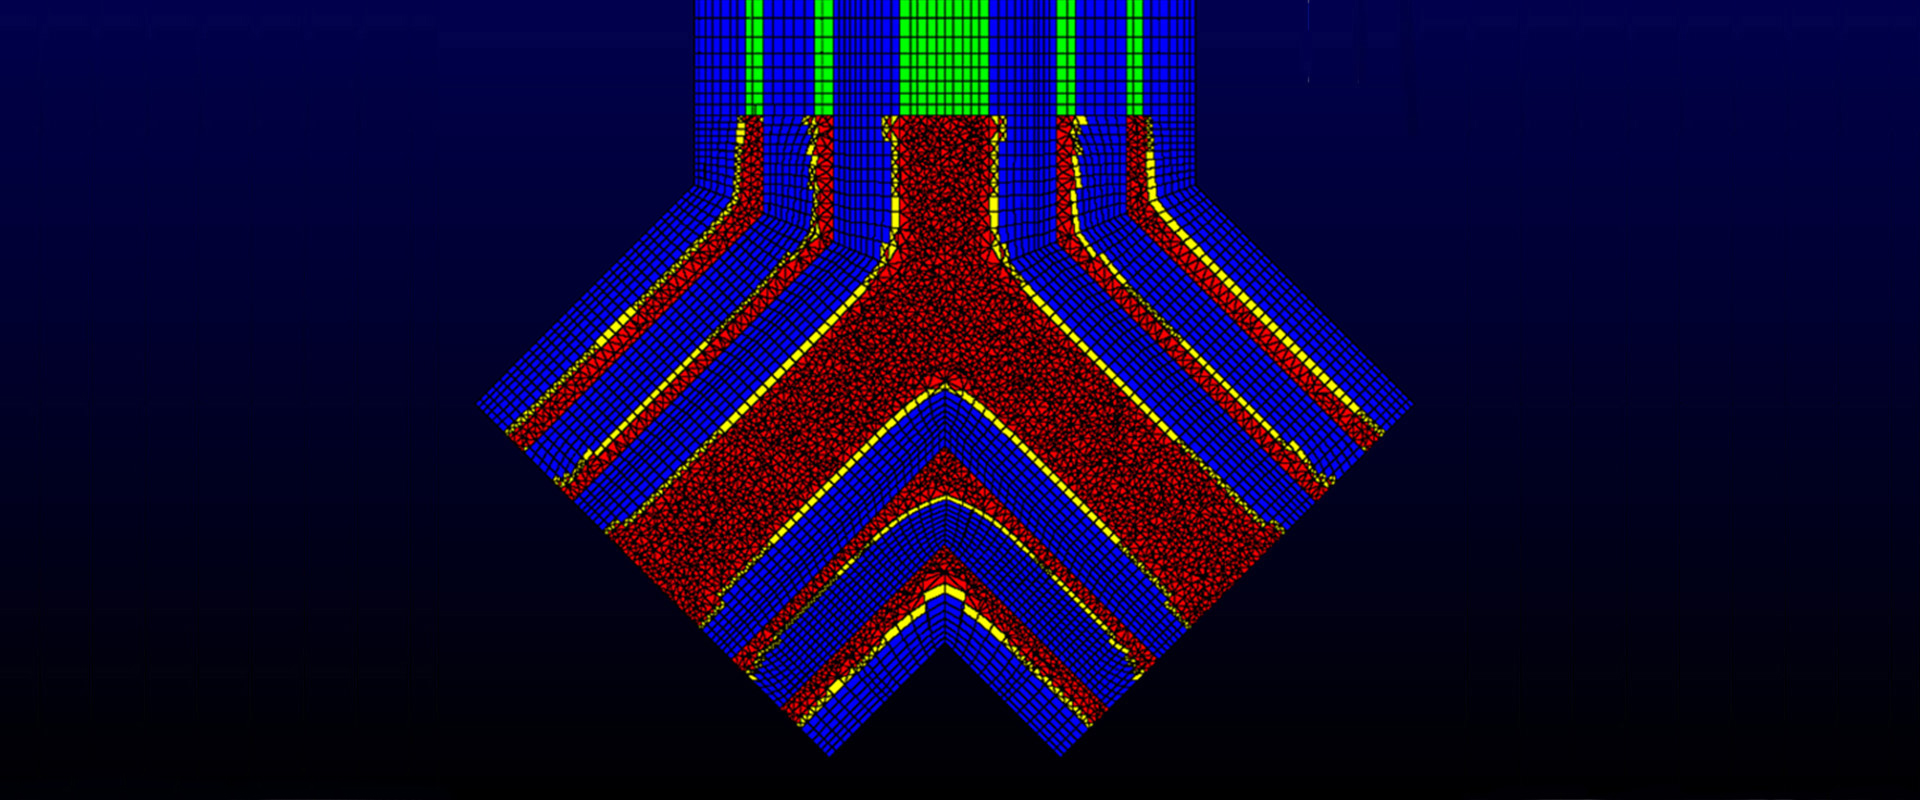
Figure 2 – Mesh configuration of the mixing chamber of Y-pipe 1
In the region of the mixing chamber, the 3D T-Rex method is used. For the first Y pipe structure, as shown in Figure 2, hexahedral cells (blue) first grow from the outer wall. The hexahedral cells then transit into pyramids (yellow) and finally into isotropic tetrahedra (red). Meanwhile, the second layer of hexahedral cells grows from an inner domain surface. This is also necessary because of the narrowed cross-section of the inlet with respect to the mixing chamber. The hexahedral cells from this surface will grow in 2 directions, both inwards and outwards. The cells growing inwards will transit into prisms and finally into isotropic tetrahedra as shown in the large red area in the middle. The cells growing outwards will meet with the cells growing from the outer wall and form the thin layer of isotropic tetrahedra together.
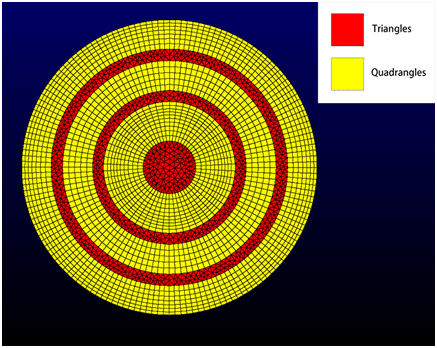
Figure 3 – 2D cells on the inlet surface of Y-pipe 2
For Y-pipe 2, a similar configuration is used. However, the variation of cross-sections is more complicated than Y-pipe 1. As shown in Figures 3 and 4, there are more layers where T-Rex cells are grown, in combination with fully hexahedral blocks.
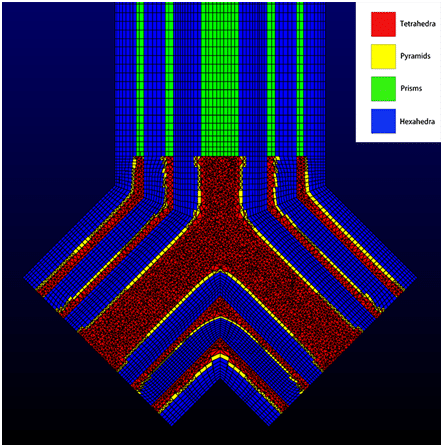
Figure 4 – Mesh configuration of the mixing chamber of Y-pipe 2.
Pointwise allows exporting its meshes to a broad range of solvers. In OpenFOAM, which is employed in this project, cell non-orthogonality is an important factor to determine mesh quality. It is defined as the angle between a line connecting the centroids of the two cells and the normal of the shared face. The “examine” panel of Pointwise allows to directly evaluate this mesh quality parameter. In general, it is desirable to keep it below 70 for most of the domains in OpenFOAM, and never exceed 75. For Y-pipe 1, the maximum cell non-orthogonality is below 70, and 120 cells have cell non-orthogonality higher than 65. They are mainly focused in the mixing chamber, close to the entrance of the mixing chamber, as shown in Figure 5. Since it is below 70, the mesh quality is satisfactory.
Considering Y-pipe 2, the results are of similarly high quality. However, most cells with higher cell non-orthogonality are concentrated on a pipe restriction at the outlet. Nevertheless, only 5 cells exceed the threshold of 70, and thus the solution convergence is not affected.
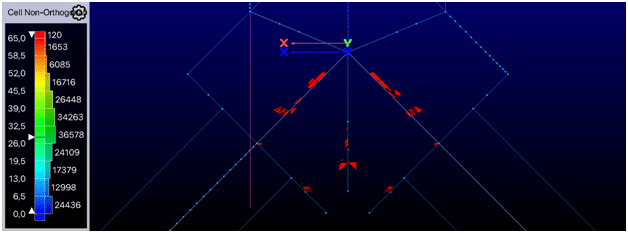
Figure 5 – Cell Highest non-orthogonal cells in the chamber of Y-pipe 1
For the simulations, the Reynolds number of the pipes is relatively small and shows that the flow crosses the laminar-to-turbulent regime (ca. 1,000-40,000). Hence, an Implicit Large Eddy Simulation (LES) has been used with OpenFOAM to predict the transitional flow behavior and observe the turbulence development. As the particles of the reactants follow the turbulent structures, their resolution is vital to assess the mixing. In Figure 5, an example of the Line Integral Convolution (LIC) plot of the instantaneous velocity field at t=5s of the 2 different Y pipes is shown. These figures clearly show the vortices near the corners in the mixing chamber, and how the flow develops from the laminar flow in the inlets into the turbulent flow.
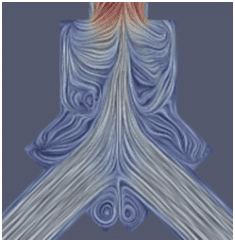
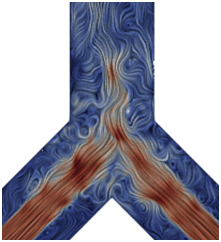
Figure 6 – LIC of the instantaneous velocity field at t = 5s. Y-pipe 1 on the left and Y-pipe 2 on the right.
Category
Biomedical
Application
Industrial Mixing Processes
Date
April 2022
Project Partner
Start-up specialized in biomaterials for dental industry
Pointwise Key Features
Extruded mesh, 3D TRex and multiblock mesh for LES applications